
Densité de population de Saint-Trond
Date de référence: 2026-01-01
392,0
habitants/km²
Saint-Trond affichait 392,0 habitants par km² en 2026, soit le 236e parmi les communes belges selon la densité de population.


- Population
- 41 987habitants
- Rang en Belgique
- 236esur 565 communes
- Évolution de la densité
- +2,3
- Date de référence
- 2026-01-01
Densité de population
À l’intérieur de la commune
La population est répartie de façon inégale. La vue ci-dessous utilise les limites exactes des secteurs statistiques de 2025 et n’attribue jamais des habitants à un polygone inconnu.100,0% des habitants sont localisés dans un secteur statistique ; 5 ne sont disponibles qu’au total communal.
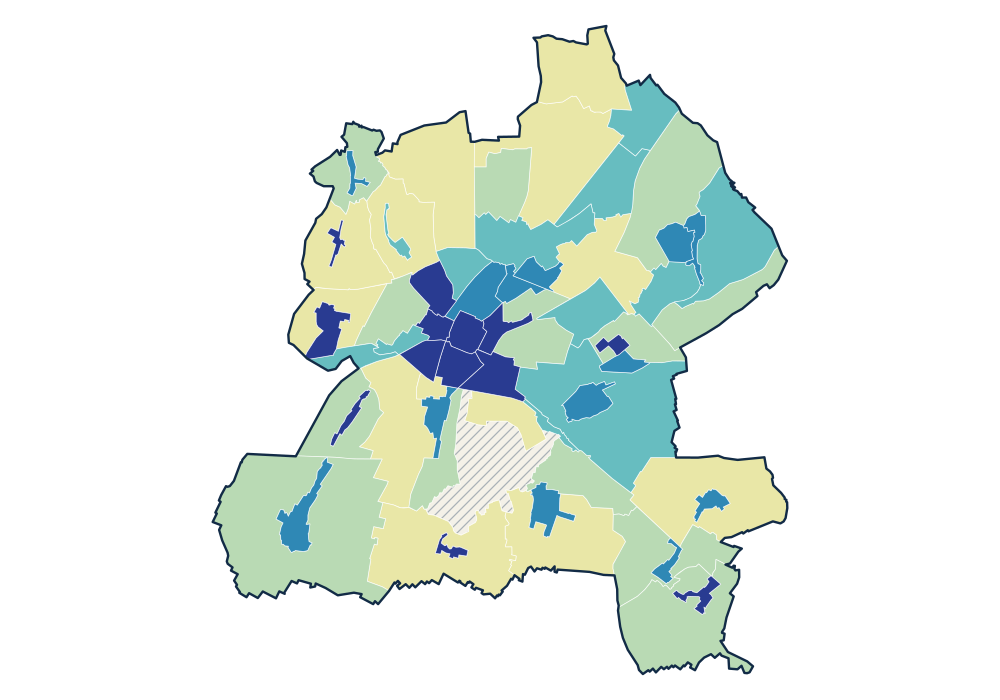
- 0 habitants
- 7,3–81,0 habitants/km²
- 83,4–159,3 habitants/km²
- 164,8–1 310,4 habitants/km²
- 1 340,6–1 784,6 habitants/km²
- 1 827,3–5 889,5 habitants/km²
Voir le tableau de données exact
| SINT-TRUIDEN - BINNENSTAD 71053A00K | 3 200 | 5 889,5 habitants/km² |
|---|---|---|
| STATION - WIJK 71053A05K | 1 999 | 5 778,7 habitants/km² |
| NIEUW SINT-TRUIDEN - WIJK 71053A50K | 3 540 | 4 781,1 habitants/km² |
| SINT-PIETER - WIJK 71053A30K | 2 822 | 4 347,5 habitants/km² |
| ZIEKEREN - WIJK 71053A32K | 1 611 | 3 177,9 habitants/km² |
Série chronologique officielle
Source : données officielles de Statbel · Statbel
Voir le tableau de données exact
| 2026 | 41 987 | 392,0 |
| 2025 | 41 743 | 389,7 |
| 2024 | 41 469 | 387,1 |
| 2023 | 41 353 | 386,1 |
| 2022 | 40 845 | 381,3 |
| 2021 | 40 557 | 378,6 |
| 2020 | 40 672 | 379,7 |
| 2019 | 40 590 | 378,9 |
| 2018 | 40 473 | 377,8 |
| 2017 | 40 169 | 375,4 |
| 2016 | 40 158 | 375,3 |
| 2015 | 39 957 | 373,4 |
| 2014 | 39 840 | 372,3 |
| 2013 | 39 769 | 371,6 |
| 2012 | 39 747 | 371,4 |
| 2011 | 39 584 | 369,9 |
| 2010 | 39 309 | 367,3 |
| 2009 | 39 117 | 365,5 |
Chiffres clés
Utilisez ces tendances de population dans Horizon Mapper pour analyser les zones de chalandise et les opportunités de localisation. Horizon Mapper