
Bevolkingsdichtheid van Les Bons Villers
Referentiedatum: 2026-01-01
227,1
inwoners/km²
Les Bons Villers telde in 2026 227,1 inwoners per km², de 366. plaats onder de Belgische gemeenten volgens bevolkingsdichtheid.


- Bevolking
- 9.757inwoners
- Rang in België
- 366.van 565 gemeenten
- Verandering in dichtheid
- +1,2
- Referentiedatum
- 2026-01-01
Bevolkingsdichtheid
Binnen de gemeente
De bevolking is ongelijk verdeeld. De onderstaande weergave gebruikt de exacte statistische-sectorgrenzen van 2025 en wijst nooit inwoners toe aan een onbekende polygoon.100,0% van de inwoners is aan een statistische sector gekoppeld; 0 is alleen beschikbaar in het gemeentetotaal.
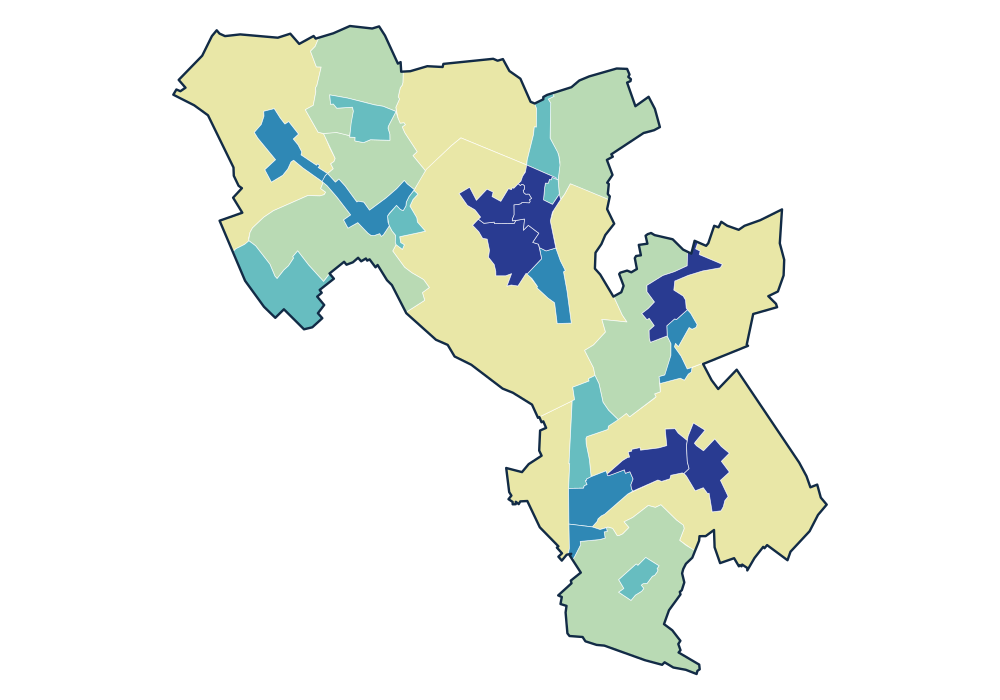
- 0 inwoners
- 3,1–17,2 inwoners/km²
- 24,5–43,2 inwoners/km²
- 78,0–955,8 inwoners/km²
- 989,4–1.271,7 inwoners/km²
- 1.465,1–1.915,6 inwoners/km²
Bekijk de exacte gegevenstabel
| LE ROUX 52075D01K | 879 | 1.915,6 inwoners/km² |
|---|---|---|
| FRASNES-LEZ-GOSSELIES-CENTRE 52075D00- | 1.178 | 1.901,0 inwoners/km² |
| LE GRAND MARAIS 52075D03K | 638 | 1.858,4 inwoners/km² |
| MELLET-CENTRE 52075A00K | 995 | 1.813,3 inwoners/km² |
| VILLERS-PERWIN-CENTRE 52075C000 | 892 | 1.636,1 inwoners/km² |
Officiële tijdreeks
Bron: officiële Statbel-gegevens · Statbel
Bekijk de exacte gegevenstabel
| 2026 | 9.757 | 227,1 |
| 2025 | 9.705 | 225,9 |
| 2024 | 9.586 | 223,1 |
| 2023 | 9.540 | 222,0 |
| 2022 | 9.510 | 221,3 |
| 2021 | 9.463 | 220,2 |
| 2020 | 9.467 | 220,3 |
| 2019 | 9.451 | 220,0 |
| 2018 | 9.457 | 220,1 |
| 2017 | 9.401 | 217,4 |
| 2016 | 9.367 | 216,6 |
| 2015 | 9.264 | 214,2 |
| 2014 | 9.256 | 214,0 |
| 2013 | 9.165 | 211,9 |
| 2012 | 9.136 | 211,2 |
| 2011 | 9.090 | 210,2 |
| 2010 | 9.066 | 209,6 |
| 2009 | 8.972 | 207,4 |
Kerncijfers
Gebruik deze bevolkingspatronen in Horizon Mapper voor verzorgingsgebied- en locatiekansenanalyses. Horizon Mapper