
Bevolkingsdichtheid van Zoutleeuw
Referentiedatum: 2026-01-01
188,0
inwoners/km²
Zoutleeuw telde in 2026 188,0 inwoners per km², de 406. plaats onder de Belgische gemeenten volgens bevolkingsdichtheid.


- Bevolking
- 8.805inwoners
- Rang in België
- 406.van 565 gemeenten
- Verandering in dichtheid
- +0,8
- Referentiedatum
- 2026-01-01
Bevolkingsdichtheid
Binnen de gemeente
De bevolking is ongelijk verdeeld. De onderstaande weergave gebruikt de exacte statistische-sectorgrenzen van 2025 en wijst nooit inwoners toe aan een onbekende polygoon.100,0% van de inwoners is aan een statistische sector gekoppeld; 0 is alleen beschikbaar in het gemeentetotaal.
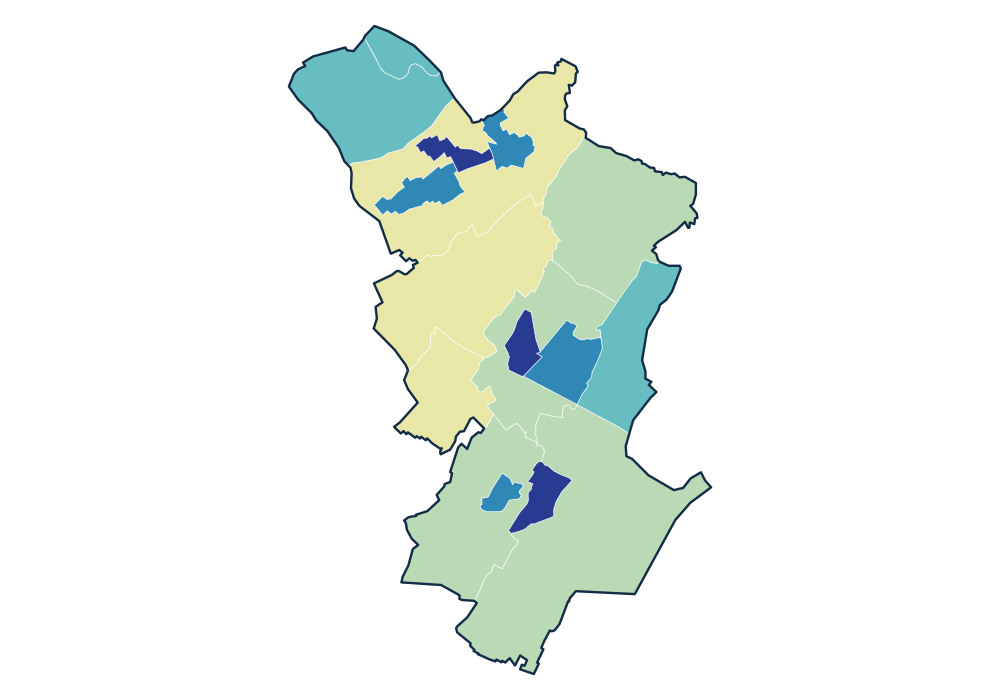
- 0 inwoners
- 47,6–67,7 inwoners/km²
- 86,3–113,6 inwoners/km²
- 142,4–213,8 inwoners/km²
- 565,8–1.008,9 inwoners/km²
- 1.102,8–2.721,3 inwoners/km²
Bekijk de exacte gegevenstabel
| ZOUTLEEUW-KERN 24130A00- | 1.316 | 2.721,3 inwoners/km² |
|---|---|---|
| SCHOOLSTRAAT-ROELSTRAAT 24130E01K | 543 | 1.301,3 inwoners/km² |
| HALLE-BOOIENHOVEN-CENTRUM 24130C00- | 704 | 1.102,8 inwoners/km² |
| DORMAAL-KERN 24130D00- | 292 | 1.008,9 inwoners/km² |
| BUDINGEN KERN - BOOMGAARDSTRAAT 24130E00K | 405 | 731,5 inwoners/km² |
Officiële tijdreeks
Bron: officiële Statbel-gegevens · Statbel
Bekijk de exacte gegevenstabel
| 2026 | 8.805 | 188,0 |
| 2025 | 8.766 | 187,1 |
| 2024 | 8.734 | 186,5 |
| 2023 | 8.668 | 185,0 |
| 2022 | 8.591 | 183,4 |
| 2021 | 8.531 | 182,1 |
| 2020 | 8.575 | 183,1 |
| 2019 | 8.480 | 181,0 |
| 2018 | 8.498 | 181,4 |
| 2017 | 8.446 | 180,5 |
| 2016 | 8.364 | 178,8 |
| 2015 | 8.324 | 177,9 |
| 2014 | 8.292 | 177,2 |
| 2013 | 8.278 | 176,9 |
| 2012 | 8.252 | 176,4 |
| 2011 | 8.240 | 176,1 |
| 2010 | 8.195 | 175,1 |
| 2009 | 8.160 | 174,4 |
Kerncijfers
Gebruik deze bevolkingspatronen in Horizon Mapper voor verzorgingsgebied- en locatiekansenanalyses. Horizon Mapper