
Bevolkingsdichtheid van Chaudfontaine
Referentiedatum: 2026-01-01
806,3
inwoners/km²
Chaudfontaine telde in 2026 806,3 inwoners per km², de 101. plaats onder de Belgische gemeenten volgens bevolkingsdichtheid.


- Bevolking
- 20.525inwoners
- Rang in België
- 101.van 565 gemeenten
- Verandering in dichtheid
- +0,1
- Referentiedatum
- 2026-01-01
Bevolkingsdichtheid
Binnen de gemeente
De bevolking is ongelijk verdeeld. De onderstaande weergave gebruikt de exacte statistische-sectorgrenzen van 2025 en wijst nooit inwoners toe aan een onbekende polygoon.100,0% van de inwoners is aan een statistische sector gekoppeld; 3 is alleen beschikbaar in het gemeentetotaal.
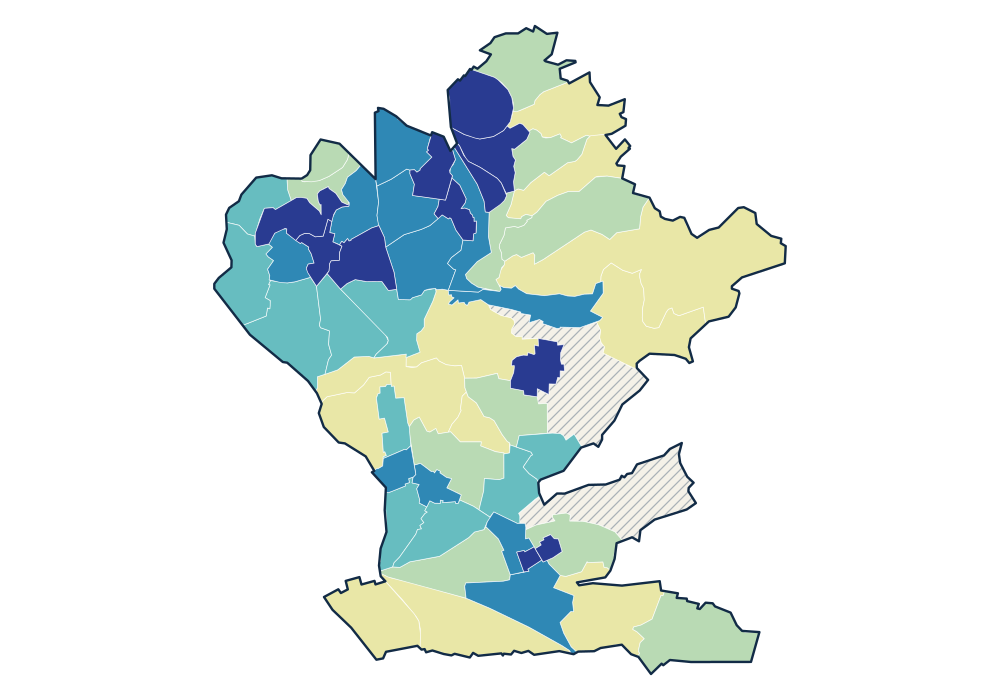
- 0 inwoners
- 22,3–427,4 inwoners/km²
- 436,2–727,9 inwoners/km²
- 797,2–1.212,5 inwoners/km²
- 1.266,1–1.756,3 inwoners/km²
- 1.890,5–4.147,8 inwoners/km²
Bekijk de exacte gegevenstabel
| VAUX-SOUS-CHEVREMONT-CENTRE 62022D00- | 1.268 | 4.147,8 inwoners/km² |
|---|---|---|
| CLOS PERLY 62022B01K | 153 | 3.468,1 inwoners/km² |
| BECHURON - RANSY 62022D01- | 1.400 | 3.216,0 inwoners/km² |
| EMBOURG-CENTRE 62022C00K | 486 | 2.970,3 inwoners/km² |
| AU TIEGE 62022B01L | 133 | 2.445,3 inwoners/km² |
Officiële tijdreeks
Bron: officiële Statbel-gegevens · Statbel
Bekijk de exacte gegevenstabel
| 2026 | 20.525 | 806,3 |
| 2025 | 20.523 | 806,2 |
| 2024 | 20.600 | 809,2 |
| 2023 | 20.572 | 808,1 |
| 2022 | 20.556 | 807,5 |
| 2021 | 20.807 | 817,3 |
| 2020 | 20.855 | 819,2 |
| 2019 | 20.800 | 817,8 |
| 2018 | 20.935 | 823,1 |
| 2017 | 20.885 | 817,7 |
| 2016 | 20.766 | 813,1 |
| 2015 | 21.001 | 822,3 |
| 2014 | 21.047 | 824,1 |
| 2013 | 21.059 | 824,5 |
| 2012 | 20.944 | 820,0 |
| 2011 | 20.940 | 819,9 |
| 2010 | 20.865 | 816,9 |
| 2009 | 20.904 | 818,5 |
Kerncijfers
Gebruik deze bevolkingspatronen in Horizon Mapper voor verzorgingsgebied- en locatiekansenanalyses. Horizon Mapper