
Official Belgian data, explained
Regional unemployment rate — Age: 15–74 years by province in Belgium (2025)
This page maps Regional unemployment rate — Age: 15–74 years for one nationally comparable 2025 slice. Every figure below uses the same disclosed definition, unit, geography and source.
Labour
What this indicator measures
Percentage of the labour force that is unemployed under EU Labour Force Survey definitions, for the selected sex, age and ISCED education group, published at NUTS 2.
Indicator dossier
Data passport
- Selected reference period
- 2025
- Geography
- provinces
- Boundary set
- Statistical sectors 2024
- Measure
- Regional unemployment rate
- Unit
- %
- Comparable areas
- 11
- Coverage
- 100%
Indicator dossier
Selected slice
Exact catalogue filters applied to the map, statistics and comparison.
- Education level
- All education levels
- Sex
- Total
- Age
- 15–74 years
Latest published slice
How to read the pattern
- Median
- 6.7%
- Unweighted area mean
- 6.5%
- Minimum
- 3%
- Maximum
- 12.6%
Across the valid national comparison set, the median is 6.7 %. Values extend from 3 to 12.6 %. This describes geographic variation; it is not a score of local quality.
Geography
Map of Belgium
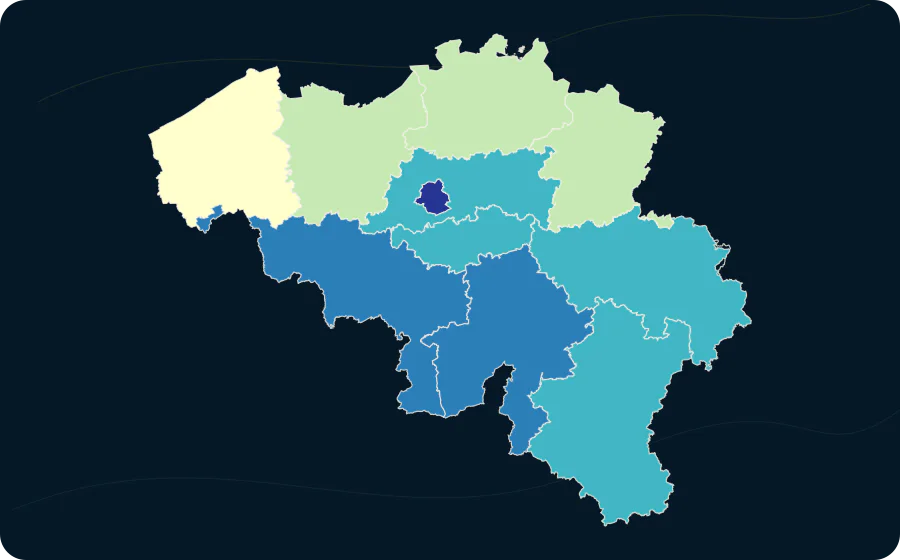
- 1.9–4.11 area
- 4.1–5.53 areas
- 5.5–7.44 areas
- 7.4–10.62 areas
- 10.6–19.21 area
Areas
Value distribution
| Value | Areas |
|---|---|
| 3–5.4 | 4 |
| 5.4–7.8 | 5 |
| 7.8–10.2 | 1 |
| 10.2–12.6 | 1 |
Explore this exact slice in the atlas Download this data as CSV
provinces
Highest and lowest values
From 11 comparable areas, the table shows a concise descriptive high-and-low sample. Equal values do not imply equal local circumstances.
| Highest | 1 | Région de Bruxelles-Capitale | 04000 | 12.6 % |
|---|---|---|---|---|
| Highest | 2 | Province du Hainaut | 50000 | 9 % |
| Highest | 3 | Province de Namur | 90000 | 7.7 % |
| Highest | 4 | Province de Liège | 60000 | 7.2 % |
| Highest | 5 | Province du Brabant wallon | 20002 | 6.7 % |
| Highest | 5 | Province du Luxembourg | 80000 | 6.7 % |
| Highest | 7 | Provincie Vlaams-Brabant | 20001 | 5.5 % |
| Highest | 8 | Provincie Limburg | 70000 | 4.4 % |
| Highest | 9 | Provincie Antwerpen | 10000 | 4.3 % |
| Highest | 10 | Provincie Oost-Vlaanderen | 40000 | 4.2 % |
| Lowest | 11 | Provincie West-Vlaanderen | 30000 | 3 % |
Method and limitations
Method and limitations
No missing value is imputed. Where colour classes are used, their breaks and colours come from the catalogue; source-declared suppression remains missing.
The area mean gives every published geographic area equal weight. It is not weighted by population, exposure or area size.
Survey estimate at province-equivalent NUTS 2 level, not a municipal rate. Eurostat break and low-reliability flags are retained; low-reliability observations are excluded from the map and ranking even when Eurostat publishes a number.
Native Belgian NUTS 2024 level-2 observations mapped by an explicit 11-code domain equality to the atlas province level; no municipal or three-region roll-up. Eurostat u/bu values remain in the audited cube but are unavailable to map and rank.
Read the methodologySources, licence and provenance
Sources, licence and provenance
- Source
- Eurostat
- Licence
- CC BY 4.0