
Official Belgian data, explained
Employment share of the age-eligible population by sector in Belgium (2021)
This page maps Employment share of the age-eligible population for one nationally comparable 2021 slice. Every figure below uses the same disclosed definition, unit, geography and source.
Labour
What this indicator measures
Employment share of the age-eligible population divided by residents at or above the national minimum age for economic activity × 100.
Source: Census 2021 S12, CD_CAS_LVL_2; additive fields m02n and m02d are rolled up before division.
Indicator dossier
Data passport
- Selected reference period
- 2021
- Geography
- statistical sectors
- Boundary set
- Statistical sectors 2021
- Measure
- Share
- Unit
- %
- Comparable areas
- 19365
- Coverage
- 97.8%
Latest published slice
How to read the pattern
- Median
- 54.6%
- Unweighted area mean
- 53.6%
- Minimum
- 0%
- Maximum
- 100%
Across the valid national comparison set, the median is 54.6 %. Values extend from 0 to 100 %. This describes geographic variation; it is not a score of local quality.
Geography
Map of Belgium
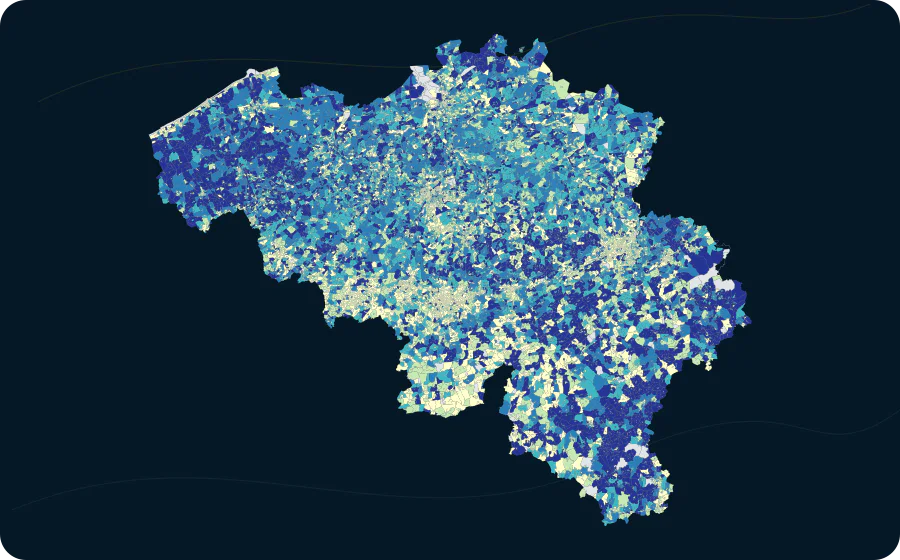
- 0–46.53885 areas
- 46.5–52.43883 areas
- 52.4–56.63839 areas
- 56.6–613906 areas
- 61–1003852 areas
Areas
Value distribution
| Value | Areas |
|---|---|
| 0–4.2 | 78 |
| 4.2–8.3 | 10 |
| 8.3–12.5 | 12 |
| 12.5–16.7 | 24 |
| 16.7–20.8 | 69 |
| 20.8–25 | 88 |
| 25–29.2 | 202 |
| 29.2–33.3 | 313 |
| 33.3–37.5 | 445 |
| 37.5–41.7 | 855 |
| 41.7–45.8 | 1478 |
| 45.8–50 | 2157 |
| 50–54.2 | 3529 |
| 54.2–58.3 | 4037 |
| 58.3–62.5 | 3232 |
| 62.5–66.7 | 1453 |
| 66.7–70.8 | 715 |
| 70.8–75 | 252 |
| 75–79.2 | 159 |
| 79.2–83.3 | 91 |
| 83.3–87.5 | 27 |
| 87.5–91.7 | 32 |
| 91.7–95.8 | 10 |
| 95.8–100 | 97 |
Explore this exact slice in the atlas Download this data as CSV
statistical sectors
Highest and lowest values
From 19365 comparable sectors, the table shows a concise high-and-low sample; the complete sector table remains in the atlas.
| Highest | 1 | PETROLEUM - SCHELDEKADEN-Z. | 11002F6MJ | 100 % |
|---|---|---|---|---|
| Highest | 1 | SPORTPALEIS | 11002Q49- | 100 % |
| Highest | 1 | SCHOONSELHOF - FORT 7 | 11002U68- | 100 % |
| Highest | 1 | HOGE AARD | 11024A142 | 100 % |
| Highest | 1 | ELSHOUTHEIDE | 11040A480 | 100 % |
| Highest | 1 | KLEIN GENT | 13010A1NV | 100 % |
| Highest | 1 | VEEDIJK | 13040A173 | 100 % |
| Highest | 1 | SCHEUT-INTERNAT | 21001A783 | 100 % |
| Lowest | 19294 | FONTAINE DU ROI | 93018D062 | 0 % |
| Lowest | 19294 | BOIS DE SENZEILLE | 93010F19- | 0 % |
| Lowest | 19294 | SOUMOY-HABITATIONS DISPERSEES | 93010B09- | 0 % |
| Lowest | 19294 | BONNIERS | 92094W081 | 0 % |
| Lowest | 19294 | NAMECHE-HABITATIONS DISPERSEES | 92003F09- | 0 % |
| Lowest | 19294 | PUSSEMANGE-HABITATIONS DISP. | 91143C19- | 0 % |
| Lowest | 19294 | BOIS | 91143B1PA | 0 % |
| Lowest | 19294 | MEUSE-RIVE-NORD | 91142F19- | 0 % |
Method and limitations
Method and limitations
No missing value is imputed. Where colour classes are used, their breaks and colours come from the catalogue; source-declared suppression remains missing.
The area mean gives every published geographic area equal weight. It is not weighted by population, exposure or area size.
Census 2021 is a snapshot on 1 January 2021, not an annual flow.
Read the methodologySources, licence and provenance