
Official Belgian data, explained
Minimum average private-household size by sector in Belgium (2021)
This page maps Minimum average private-household size for one nationally comparable 2021 slice. Every figure below uses the same disclosed definition, unit, geography and source.
Households
What this indicator measures
Weighted lower-bound household members divided by private households; 11+ is weighted as 11. The open-ended 11+ category is weighted as 11, so the published result is a lower bound.
Weighted household-size lower bound divided by private households. The open-ended 11+ category is weighted as 11; additive components are rolled up before division.
Indicator dossier
Data passport
- Selected reference period
- 2021
- Geography
- statistical sectors
- Boundary set
- Statistical sectors 2021
- Measure
- Average
- Unit
- persons/household
- Comparable areas
- 19360
- Coverage
- 97.8%
Latest published slice
How to read the pattern
- Median
- 2.38persons/household
- Unweighted area mean
- 2.37persons/household
- Minimum
- 1persons/household
- Maximum
- 8persons/household
Across the valid national comparison set, the median is 2.38 persons/household. Values extend from 1 to 8 persons/household. This describes geographic variation; it is not a score of local quality.
Geography
Map of Belgium
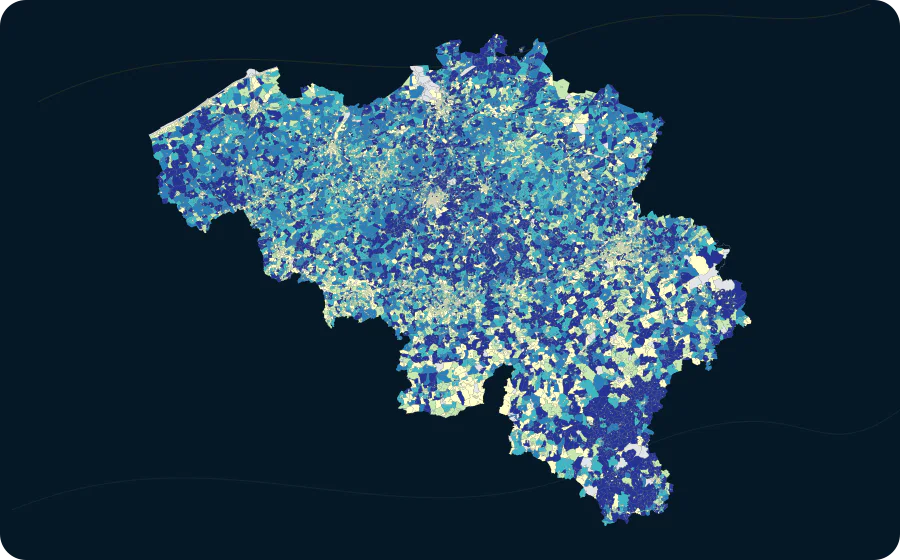
- 1–2.153891 areas
- 2.15–2.323861 areas
- 2.32–2.453903 areas
- 2.45–2.63889 areas
- 2.6–83816 areas
Areas
Value distribution
| Value | Areas |
|---|---|
| 1–1.29 | 103 |
| 1.29–1.58 | 302 |
| 1.58–1.88 | 915 |
| 1.88–2.17 | 2833 |
| 2.17–2.46 | 7735 |
| 2.46–2.75 | 5743 |
| 2.75–3.04 | 1285 |
| 3.04–3.33 | 271 |
| 3.33–3.63 | 73 |
| 3.63–3.92 | 27 |
| 3.92–4.21 | 39 |
| 4.21–4.5 | 12 |
| 4.5–4.79 | 8 |
| 4.79–5.08 | 9 |
| 5.08–5.38 | 1 |
| 5.38–5.67 | 0 |
| 5.67–5.96 | 0 |
| 5.96–6.25 | 3 |
| 6.25–6.54 | 0 |
| 6.54–6.83 | 0 |
| 6.83–7.13 | 0 |
| 7.13–7.42 | 0 |
| 7.42–7.71 | 0 |
| 7.71–8 | 1 |
Explore this exact slice in the atlas Download this data as CSV
statistical sectors
Highest and lowest values
From 19360 comparable sectors, the table shows a concise high-and-low sample; the complete sector table remains in the atlas.
| Highest | 1 | LES CRETES | 91143B31- | 8 persons/household |
|---|---|---|---|---|
| Highest | 2 | LIMELETTE-HABITATIONS DISP. | 25121C091 | 6 persons/household |
| Highest | 2 | PARK LAGACHE | 45041A082 | 6 persons/household |
| Highest | 2 | NEREM - VERSPR. BEW.- ZUID | 73083J082 | 6 persons/household |
| Highest | 5 | IMMERSEELVELD | 11052A191 | 5.33 persons/household |
| Highest | 6 | GROENE HOEK - TER BEKE | 11002U5PA | 5 persons/household |
| Highest | 6 | KLAVERBLAD | 11002U69- | 5 persons/household |
| Highest | 6 | HEIDE VELDE | 23003D0MS | 5 persons/household |
| Lowest | 19286 | FONTAINE DU ROI | 93018D062 | 1 persons/household |
| Lowest | 19286 | BOIS DE SENZEILLE | 93010F19- | 1 persons/household |
| Lowest | 19286 | DOUAIRE | 92101A063 | 1 persons/household |
| Lowest | 19286 | BONNIERS | 92094W081 | 1 persons/household |
| Lowest | 19286 | BOIS | 91143B1PA | 1 persons/household |
| Lowest | 19286 | MEUSE-RIVE-NORD | 91142F19- | 1 persons/household |
| Lowest | 19286 | VILLAGE DE VACANCES FAMI- LIALES ET CAMPING COMMUNAL | 91142C062 | 1 persons/household |
| Lowest | 19286 | SPONTIN-CENTRE NORD | 91141D01- | 1 persons/household |
Method and limitations
Method and limitations
No missing value is imputed. Where colour classes are used, their breaks and colours come from the catalogue; source-declared suppression remains missing.
The area mean gives every published geographic area equal weight. It is not weighted by population, exposure or area size.
Census 2021 is a snapshot on 1 January 2021, not an annual flow.
Read the methodologySources, licence and provenance