
Official Belgian data, explained
Share: Post-secondary non-tertiary education by sector in Belgium (2021)
This page maps Share: Post-secondary non-tertiary education for one nationally comparable 2021 slice. Every figure below uses the same disclosed definition, unit, geography and source.
Education
What this indicator measures
Post-secondary non-tertiary education divided by residents aged 15+ with a known education level × 100.
Source: Census 2021 S11, CD_EDU; additive fields m06n and m06d are rolled up before division.
Indicator dossier
Data passport
- Selected reference period
- 2021
- Geography
- statistical sectors
- Boundary set
- Statistical sectors 2021
- Measure
- Share
- Unit
- %
- Comparable areas
- 19354
- Coverage
- 97.8%
Latest published slice
How to read the pattern
- Median
- 3.1%
- Unweighted area mean
- 3.7%
- Minimum
- 0%
- Maximum
- 100%
Across the valid national comparison set, the median is 3.1 %. Values extend from 0 to 100 %. This describes geographic variation; it is not a score of local quality.
Geography
Map of Belgium
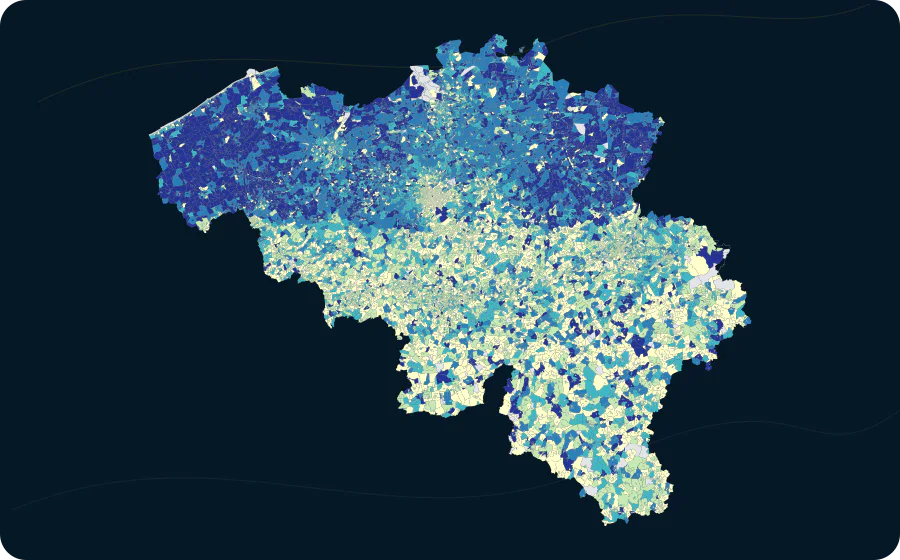
- 0–1.43759 areas
- 1.4–2.43865 areas
- 2.4–3.83896 areas
- 3.8–5.84039 areas
- 5.8–1003795 areas
Areas
Value distribution
| Value | Areas |
|---|---|
| 0–4.2 | 12316 |
| 4.2–8.3 | 6016 |
| 8.3–12.5 | 827 |
| 12.5–16.7 | 107 |
| 16.7–20.8 | 49 |
| 20.8–25 | 3 |
| 25–29.2 | 16 |
| 29.2–33.3 | 10 |
| 33.3–37.5 | 0 |
| 37.5–41.7 | 2 |
| 41.7–45.8 | 0 |
| 45.8–50 | 0 |
| 50–54.2 | 6 |
| 54.2–58.3 | 0 |
| 58.3–62.5 | 0 |
| 62.5–66.7 | 0 |
| 66.7–70.8 | 0 |
| 70.8–75 | 0 |
| 75–79.2 | 0 |
| 79.2–83.3 | 0 |
| 83.3–87.5 | 0 |
| 87.5–91.7 | 0 |
| 91.7–95.8 | 0 |
| 95.8–100 | 2 |
Explore this exact slice in the atlas Download this data as CSV
statistical sectors
Highest and lowest values
From 19354 comparable sectors, the table shows a concise high-and-low sample; the complete sector table remains in the atlas.
| Highest | 1 | TRANSPORTZONE | 13014C0MA | 100 % |
|---|---|---|---|---|
| Highest | 1 | RIEME | 44021M57- | 100 % |
| Highest | 3 | ZONING GHISLENGHIEN 2 | 51004F0PN | 50 % |
| Highest | 3 | YERNEE- HABITATIONS DISPERSEES | 61043C09- | 50 % |
| Highest | 3 | LA LONGUE HAIE EST | 62120C695 | 50 % |
| Highest | 3 | INDUSTRIEPARK-ALBERTKANAAL-W. | 71004B17- | 50 % |
| Highest | 3 | MUSSCHENNEST | 72038B062 | 50 % |
| Highest | 3 | LESSE - HABITATIONS DISPERSEES | 84035G19- | 50 % |
| Lowest | 17329 | LORET | 93090H063 | 0 % |
| Lowest | 17329 | BOIS DE NISMES | 93090G191 | 0 % |
| Lowest | 17329 | TIENNES DE NISMES | 93090G091 | 0 % |
| Lowest | 17329 | OIGNIES-EN-THIERACHE-HAB.DISP. | 93090F091 | 0 % |
| Lowest | 17329 | OIGNIES VILLAGE DE VACANCES | 93090F064 | 0 % |
| Lowest | 17329 | FLACHE - VALLEE DES PRES | 93090F022 | 0 % |
| Lowest | 17329 | LE MESNIL - HABITATIONS DISP. | 93090E09- | 0 % |
| Lowest | 17329 | BOIS DE MAREE | 93090D19- | 0 % |
Method and limitations
Method and limitations
No missing value is imputed. Where colour classes are used, their breaks and colours come from the catalogue; source-declared suppression remains missing.
The area mean gives every published geographic area equal weight. It is not weighted by population, exposure or area size.
Census 2021 is a snapshot on 1 January 2021, not an annual flow.
Read the methodologySources, licence and provenance