
Official Belgian data, explained
Middle education among known 25+ by municipality in Belgium (2017)
This page maps Middle education among known 25+ for one nationally comparable 2017 slice. Every figure below uses the same disclosed definition, unit, geography and source.
Education
What this indicator measures
Middle education among known 25+
Indicator dossier
Data passport
- Selected reference period
- 2017
- Geography
- municipalities
- Boundary set
- Statistical sectors 2011-2017
- Measure
- Middle education among known 25+
- Unit
- %
- Comparable areas
- 589
- Coverage
- 100%
Latest published slice
How to read the pattern
- Median
- 33.2%
- Unweighted area mean
- 32.8%
- Minimum
- 22.6%
- Maximum
- 41.1%
Across the valid national comparison set, the median is 33.2 %. Values extend from 22.6 to 41.1 %. This describes geographic variation; it is not a score of local quality.
Geography
Map of Belgium
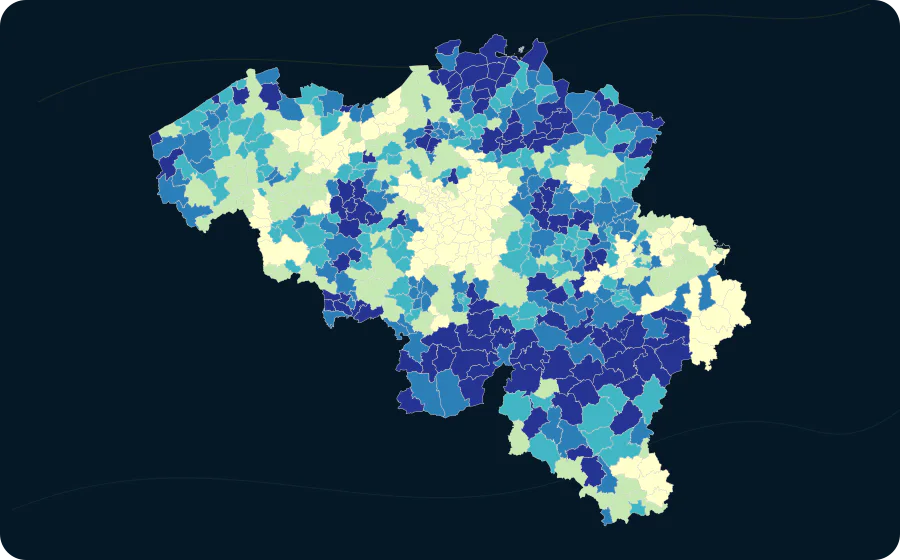
- 22.6–30.7119 areas
- 30.7–32.5117 areas
- 32.5–33.8117 areas
- 33.8–35116 areas
- 35–41.1120 areas
Areas
Value distribution
| Value | Areas |
|---|---|
| 22.6–23.4 | 5 |
| 23.4–24.1 | 3 |
| 24.1–24.9 | 4 |
| 24.9–25.7 | 10 |
| 25.7–26.4 | 6 |
| 26.4–27.2 | 8 |
| 27.2–28 | 4 |
| 28–28.8 | 10 |
| 28.8–29.5 | 23 |
| 29.5–30.3 | 18 |
| 30.3–31.1 | 39 |
| 31.1–31.8 | 47 |
| 31.8–32.6 | 66 |
| 32.6–33.4 | 68 |
| 33.4–34.1 | 82 |
| 34.1–34.9 | 70 |
| 34.9–35.7 | 54 |
| 35.7–36.5 | 30 |
| 36.5–37.2 | 25 |
| 37.2–38 | 8 |
| 38–38.8 | 7 |
| 38.8–39.5 | 1 |
| 39.5–40.3 | 0 |
| 40.3–41.1 | 1 |
Explore this exact slice in the atlas Download this data as CSV
municipalities
Highest and lowest values
From 589 comparable areas, the table shows a concise descriptive high-and-low sample. Equal values do not imply equal local circumstances.
| Highest | 1 | Stabroek | 11044 | 41.1 % |
|---|---|---|---|---|
| Highest | 2 | Herstappe | 73028 | 39.1 % |
| Highest | 3 | Linter | 24133 | 38.4 % |
| Highest | 4 | Rendeux | 83044 | 38.3 % |
| Highest | 5 | Anhée | 91005 | 38.3 % |
| Highest | 6 | Onhaye | 91103 | 38.2 % |
| Highest | 7 | Brecht | 11009 | 38.2 % |
| Highest | 8 | Geraardsbergen | 41018 | 38.1 % |
| Highest | 9 | Balen | 13003 | 38.1 % |
| Highest | 10 | Meerhout | 13021 | 38 % |
| Lowest | 589 | Leuven | 24062 | 22.6 % |
| Lowest | 588 | Woluwe-Saint-Pierre | 21019 | 23.1 % |
| Lowest | 587 | Saint-Gilles | 21013 | 23.2 % |
| Lowest | 586 | Wezembeek-Oppem | 23103 | 23.3 % |
| Lowest | 585 | Saint-Josse-ten-Noode | 21014 | 23.4 % |
| Lowest | 584 | Kraainem | 23099 | 23.4 % |
| Lowest | 583 | Etterbeek | 21005 | 23.5 % |
| Lowest | 582 | Watermael-Boitsfort | 21017 | 23.6 % |
| Lowest | 581 | Auderghem | 21002 | 24.5 % |
| Lowest | 580 | Ixelles | 21009 | 24.5 % |
Method and limitations
Method and limitations
No missing value is imputed. Where colour classes are used, their breaks and colours come from the catalogue; source-declared suppression remains missing.
The area mean gives every published geographic area equal weight. It is not weighted by population, exposure or area size.
Education shares use only age-25+ LOW/MIDDLE/HIGH as the known denominator. UNK is excluded from attainment shares and exposed through the known-coverage KPI. District components are summed through explicit municipality districtCode and shares are recomputed after selection.
Statbel DataLab reference year 2017.
Read the methodologySources, licence and provenance