
Official Belgian data, explained
Positive COVID-19 tests by province in Belgium (2025-04-30)
This page maps Positive COVID-19 tests for one nationally comparable 2025-04-30 slice. Every figure below uses the same disclosed definition, unit, geography and source.
Health
What this indicator measures
COVID-19 surveillance series; values are publisher revisions for the selected source period and dimensions.
Indicator dossier
Data passport
- Selected reference period
- 2025-04-30
- Source-series coverage
- 1 Mar 2020–30 Apr 2025
- Geography
- provinces
- Boundary set
- Statistical sectors 2025
- Measure
- Positive COVID-19 tests
- Unit
- tests
- Comparable areas
- 11
- Coverage
- 100%
Latest published slice
How to read the pattern
- Median
- 2tests
- Unweighted area mean
- 3tests
- Minimum
- 0tests
- Maximum
- 7tests
Across the valid national comparison set, the median is 2 tests. Values extend from 0 to 7 tests. This describes geographic variation; it is not a score of local quality.
Geography
Map of Belgium
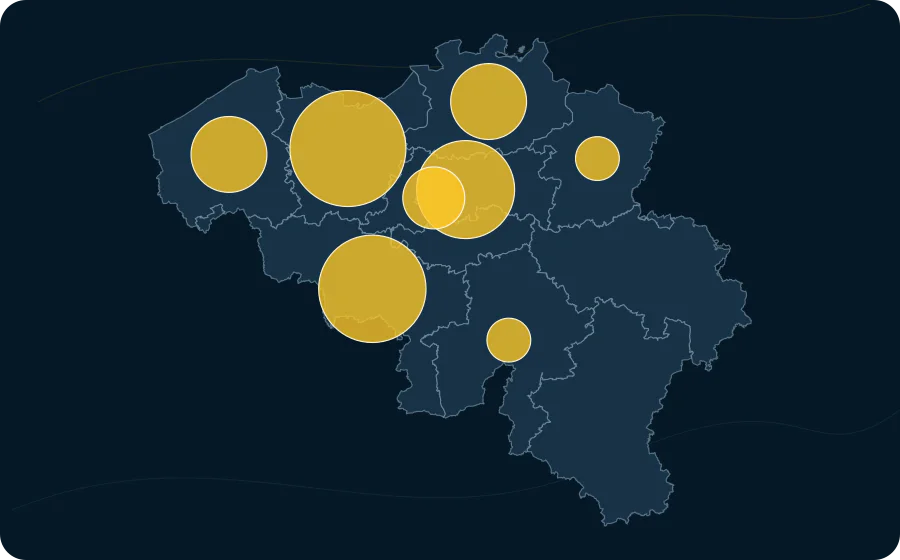
- 7circle area
- 2circle area
- 1circle area
Areas
Value distribution
| Value | Areas |
|---|---|
| 0–2 | 6 |
| 2–5 | 2 |
| 5–7 | 3 |
Explore this exact slice in the atlas Download this data as CSV
provinces
Highest and lowest values
From 11 comparable areas, the table shows a concise descriptive high-and-low sample. Equal values do not imply equal local circumstances.
| Highest | 1 | Provincie Oost-Vlaanderen | 40000 | 7 tests |
|---|---|---|---|---|
| Highest | 2 | Province du Hainaut | 50000 | 6 tests |
| Highest | 3 | Provincie Vlaams-Brabant | 20001 | 5 tests |
| Highest | 4 | Provincie Antwerpen | 10000 | 3 tests |
| Highest | 4 | Provincie West-Vlaanderen | 30000 | 3 tests |
| Highest | 6 | Région de Bruxelles-Capitale | 04000 | 2 tests |
| Highest | 7 | Provincie Limburg | 70000 | 1 tests |
| Highest | 7 | Province de Namur | 90000 | 1 tests |
| Highest | 9 | Province du Brabant wallon | 20002 | 0 tests |
| Highest | 9 | Province de Liège | 60000 | 0 tests |
| Lowest | 9 | Province du Luxembourg | 80000 | 0 tests |
Method and limitations
Method and limitations
No missing value is imputed. Where colour classes are used, their breaks and colours come from the catalogue; source-declared suppression remains missing.
The area mean gives every published geographic area equal weight. It is not weighted by population, exposure or area size.
COVID-19 surveillance series; values are publisher revisions for the selected source period and dimensions.
Source-native province observations; no higher-grain value is assigned to a lower geography.
Read the methodologySources, licence and provenance
Sources, licence and provenance
- Source
- Sciensano
- Reuse terms
- Public source; explicit reuse terms were not stated by the publisher.
- Licence
- CC BY 4.0