
Official Belgian data, explained
Share: Under 18 by municipality in Belgium (2026)
This page maps Share: Under 18 for one nationally comparable 2026 slice. Every figure below uses the same disclosed definition, unit, geography and source.
Population
What this indicator measures
Residents aged 0 through 17.
Official Statbel measure for Under 18.
Share. Matching-category residents divided by total residents in the same area and reference date × 100.
Indicator dossier
Data passport
- Selected reference period
- 2026
- Geography
- municipalities
- Boundary set
- Statistical sectors 2026
- Measure
- Share
- Unit
- %
- Comparable areas
- 565
- Coverage
- 100%
Latest published slice
How to read the pattern
- Median
- 19.2%
- Unweighted area mean
- 19.2%
- Minimum
- 8.9%
- Maximum
- 26.5%
Across the valid national comparison set, the median is 19.2 %. Values extend from 8.9 to 26.5 %. This describes geographic variation; it is not a score of local quality.
Geography
Map of Belgium
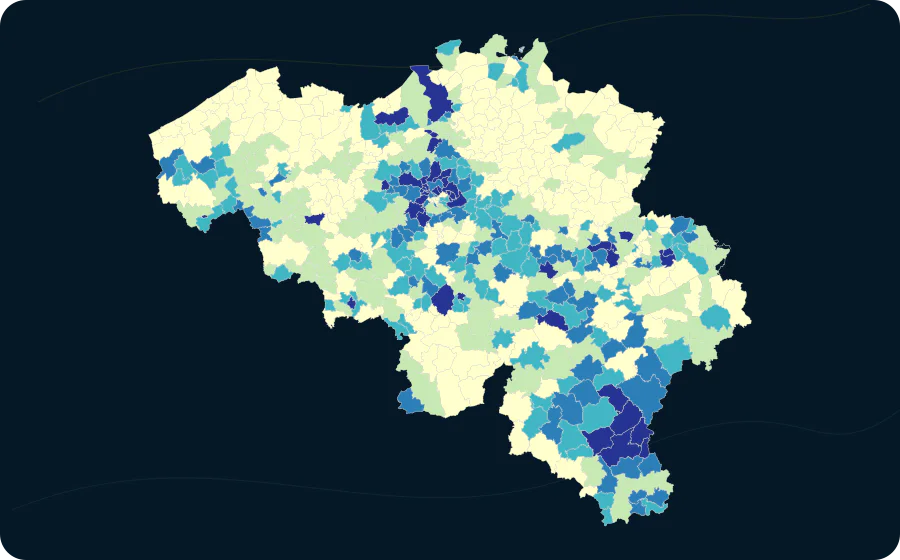
- 8.8–18.6208 areas
- 18.6–19.6138 areas
- 19.6–20.6105 areas
- 20.6–21.969 areas
- 21.9–29.245 areas
Areas
Value distribution
| Value | Areas |
|---|---|
| 8.9–9.6 | 1 |
| 9.6–10.3 | 0 |
| 10.3–11.1 | 2 |
| 11.1–11.8 | 2 |
| 11.8–12.5 | 1 |
| 12.5–13.3 | 2 |
| 13.3–14 | 1 |
| 14–14.7 | 0 |
| 14.7–15.5 | 0 |
| 15.5–16.2 | 15 |
| 16.2–16.9 | 31 |
| 16.9–17.7 | 47 |
| 17.7–18.4 | 74 |
| 18.4–19.2 | 101 |
| 19.2–19.9 | 106 |
| 19.9–20.6 | 73 |
| 20.6–21.4 | 41 |
| 21.4–22.1 | 30 |
| 22.1–22.8 | 13 |
| 22.8–23.6 | 16 |
| 23.6–24.3 | 3 |
| 24.3–25 | 5 |
| 25–25.8 | 0 |
| 25.8–26.5 | 1 |
Explore this exact slice in the atlas Download this data as CSV
municipalities
Highest and lowest values
From 565 comparable areas, the table shows a concise descriptive high-and-low sample. Equal values do not imply equal local circumstances.
| Highest | 1 | Molenbeek-Saint-Jean | 21012 | 26.5 % |
|---|---|---|---|---|
| Highest | 2 | Dison | 63020 | 25 % |
| Highest | 3 | Koekelberg | 21011 | 25 % |
| Highest | 4 | Anderlecht | 21001 | 24.9 % |
| Highest | 5 | Vilvoorde | 23088 | 24.9 % |
| Highest | 6 | Léglise | 84033 | 24.8 % |
| Highest | 7 | Machelen | 23047 | 24.3 % |
| Highest | 8 | Berchem-Sainte-Agathe | 21003 | 23.9 % |
| Highest | 9 | Farciennes | 52018 | 23.7 % |
| Highest | 10 | Martelange | 81013 | 23.4 % |
| Lowest | 565 | Koksijde | 38014 | 8.9 % |
| Lowest | 564 | Knokke-Heist | 31043 | 10.5 % |
| Lowest | 563 | Nieuwpoort | 38016 | 10.6 % |
| Lowest | 562 | Middelkerke | 35011 | 11.2 % |
| Lowest | 561 | De Haan | 35029 | 11.8 % |
| Lowest | 560 | De Panne | 38008 | 12.3 % |
| Lowest | 559 | Blankenberge | 31004 | 12.6 % |
| Lowest | 558 | Ixelles | 21009 | 13.2 % |
| Lowest | 557 | Vresse-sur-Semois | 91143 | 13.5 % |
| Lowest | 556 | Saint-Gilles | 21013 | 15.6 % |
Method and limitations
Method and limitations
No missing value is imputed. Where colour classes are used, their breaks and colours come from the catalogue; source-declared suppression remains missing.
The area mean gives every published geographic area equal weight. It is not weighted by population, exposure or area size.
Reference population on 1 January.
Read the methodologySources, licence and provenance