
Population density of Leuze-en-Hainaut
Reference date: 2026-01-01
190.9
residents/km²
Leuze-en-Hainaut recorded 190.9 residents per km² in 2026, ranking 402nd among Belgium's municipalities by population density.


- Population
- 14,217residents
- Rank in Belgium
- 402ndout of 565 municipalities
- Density change
- +0.2
- Reference date
- 2026-01-01
Population density
Inside the municipality
Population is unevenly distributed. The view below uses exact 2025 statistical-sector boundaries and never assigns residents to an unknown polygon.100.0% of residents are located to a statistical sector; 0 remain available only in the municipality total.
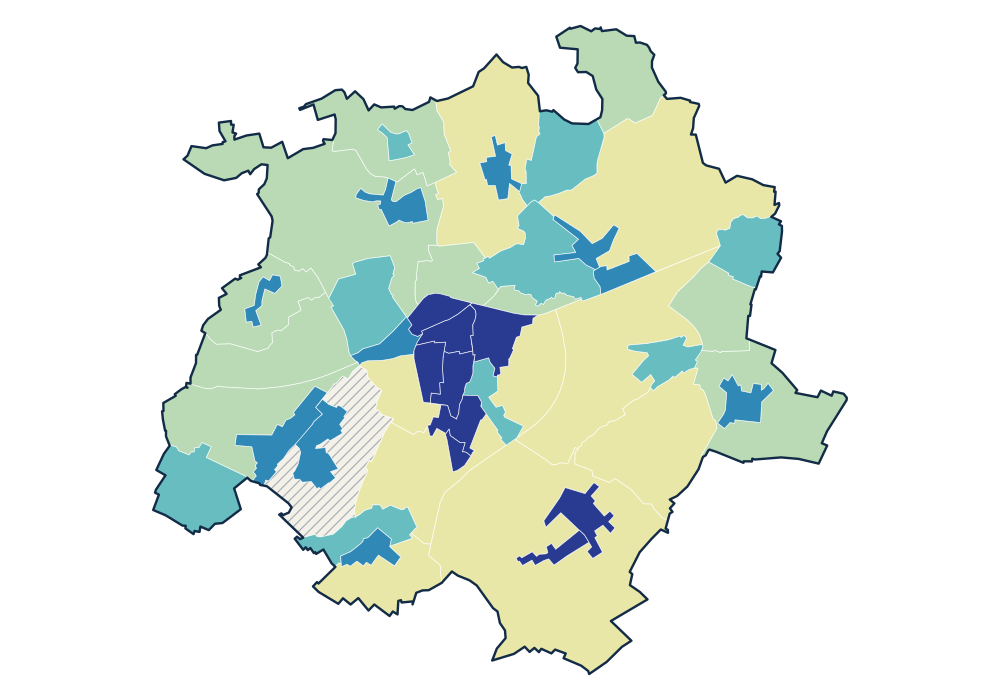
- 0 residents
- 7.5–34.7 residents/km²
- 39.6–115.3 residents/km²
- 117.2–566.1 residents/km²
- 598.9–911.4 residents/km²
- 950.3–3,956.1 residents/km²
View the exact data table
| LEUZE-CENTRE 57094A00K | 1,724 | 3,956.1 residents/km² |
|---|---|---|
| BON-AIR 57094A03K | 1,454 | 3,687.0 residents/km² |
| RIEU D'HERSEAU 57094A02K | 916 | 1,970.3 residents/km² |
| SAINT-MARTIN 57094A01K | 1,037 | 1,435.1 residents/km² |
| CARON 57094F01K | 316 | 1,310.4 residents/km² |
Official time series
Source: official Statbel data · Statbel
View the exact data table
| 2026 | 14,217 | 190.9 |
| 2025 | 14,200 | 190.7 |
| 2024 | 14,201 | 190.7 |
| 2023 | 14,097 | 189.3 |
| 2022 | 13,998 | 188.0 |
| 2021 | 13,959 | 187.5 |
| 2020 | 13,941 | 187.2 |
| 2019 | 13,850 | 186.0 |
| 2018 | 13,886 | 186.5 |
| 2017 | 13,814 | 185.5 |
| 2016 | 13,699 | 184.0 |
| 2015 | 13,625 | 183.0 |
| 2014 | 13,537 | 181.8 |
| 2013 | 13,610 | 182.8 |
| 2012 | 13,514 | 181.5 |
| 2011 | 13,525 | 181.6 |
| 2010 | 13,407 | 180.0 |
| 2009 | 13,412 | 180.1 |
Key figures
Use these population patterns in Horizon Mapper for catchment and location-opportunity analysis. Horizon Mapper