
Official Belgian data, explained
Tertiary-attainment gap (women minus men) by sector in Belgium (2021)
This page maps Tertiary-attainment gap (women minus men) for one nationally comparable 2021 slice. Every figure below uses the same disclosed definition, unit, geography and source.
Education
What this indicator measures
Tertiary-attainment gap (women minus men). Difference between sex-specific rates, in percentage points; zero is the neutral midpoint.
Difference in percentage points between two sex-specific rates (positive-means-higher-female-rate). Source: Census 2021 S11, CD_EDU; all four rate components are additive and the gap is recomputed after roll-up.
Indicator dossier
Data passport
- Selected reference period
- 2021
- Geography
- statistical sectors
- Boundary set
- Statistical sectors 2021
- Measure
- Gap
- Unit
- percentage points
- Comparable areas
- 19277
- Coverage
- 97.4%
Latest published slice
How to read the pattern
- Median
- 6.3percentage points
- Unweighted area mean
- 7.1percentage points
- Minimum
- -100percentage points
- Maximum
- 100percentage points
Across the valid national comparison set, the median is 6.3 percentage points. Values extend from -100 to 100 percentage points. This describes geographic variation; it is not a score of local quality.
Geography
Map of Belgium
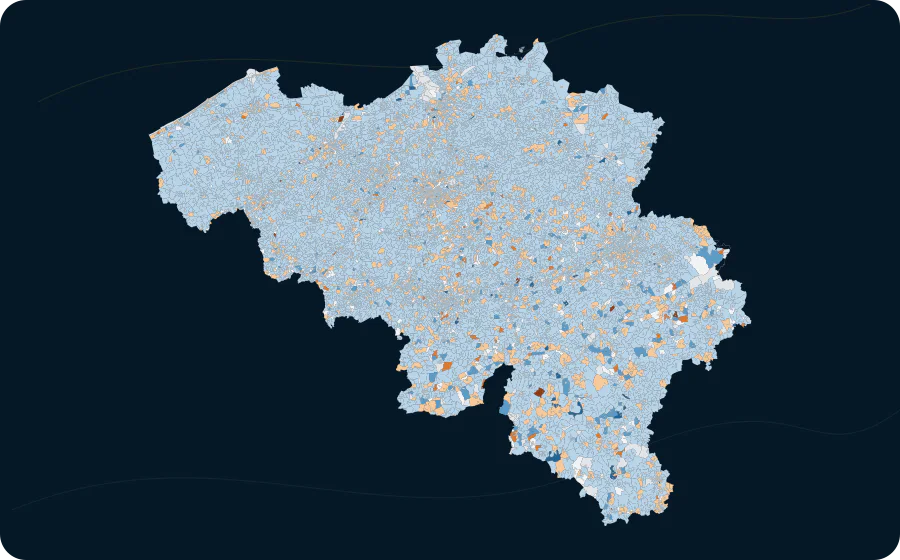
- -100–-66.710 areas
- -66.7–-33.387 areas
- -33.3–-0.12431 areas
- -0.1–0.1384 areas
- 0.1–33.316012 areas
- 33.3–66.7303 areas
- 66.7–10050 areas
Areas
Value distribution
| Value | Areas |
|---|---|
| -100–-91.7 | 10 |
| -91.7–-83.3 | 0 |
| -83.3–-75 | 0 |
| -75–-66.7 | 6 |
| -66.7–-58.3 | 2 |
| -58.3–-50 | 0 |
| -50–-41.7 | 34 |
| -41.7–-33.3 | 14 |
| -33.3–-25 | 61 |
| -25–-16.7 | 134 |
| -16.7–-8.3 | 303 |
| -8.3–0 | 1987 |
| 0–8.3 | 9434 |
| 8.3–16.7 | 5340 |
| 16.7–25 | 1297 |
| 25–33.3 | 357 |
| 33.3–41.7 | 118 |
| 41.7–50 | 49 |
| 50–58.3 | 64 |
| 58.3–66.7 | 5 |
| 66.7–75 | 15 |
| 75–83.3 | 10 |
| 83.3–91.7 | 1 |
| 91.7–100 | 36 |
Explore this exact slice in the atlas Download this data as CSV
statistical sectors
Highest and lowest values
From 19277 comparable sectors, the table shows a concise high-and-low sample; the complete sector table remains in the atlas.
| Highest | 1 | SCHOONSELHOF - FORT 7 | 11002U68- | 100 percentage points |
|---|---|---|---|---|
| Highest | 1 | BOLLAAK | 11035D082 | 100 percentage points |
| Highest | 1 | AVENUE DES CROIX DU FEU | 21004E292 | 100 percentage points |
| Highest | 1 | CIMETIERE - ST.-GILLES | 21016A692 | 100 percentage points |
| Highest | 1 | BOIS | 21019A492 | 100 percentage points |
| Highest | 1 | ZAVENTEM IND. TERREIN-KEIBERG | 23094A0MJ | 100 percentage points |
| Highest | 1 | LES FORGES | 25105C072 | 100 percentage points |
| Highest | 1 | MARKVALLEI | 41018R08- | 100 percentage points |
| Lowest | 19268 | GRANDE SALLE - LES TOMBES | 92094N090 | -100 percentage points |
| Lowest | 19268 | BEHAUT - EST | 85045D19- | -100 percentage points |
| Lowest | 19268 | AU DESSUS DU CHEMIN DE FER | 85009F291 | -100 percentage points |
| Lowest | 19268 | FAYS-FAMENNE-HABITATIONS DISP. | 84075D19- | -100 percentage points |
| Lowest | 19268 | HERBET-HABITATIONS DISPERSEES | 83012H19- | -100 percentage points |
| Lowest | 19268 | PATTON - ZONING | 81001A273 | -100 percentage points |
| Lowest | 19268 | WEGIMONT-BAIRSOU-BONNESOUMONT | 63086B09- | -100 percentage points |
| Lowest | 19268 | LEAUCOURT-RIVAGE | 57062C081 | -100 percentage points |
Method and limitations
Method and limitations
No missing value is imputed. Where colour classes are used, their breaks and colours come from the catalogue; source-declared suppression remains missing.
The area mean gives every published geographic area equal weight. It is not weighted by population, exposure or area size.
Census 2021 is a snapshot on 1 January 2021, not an annual flow.
Read the methodologySources, licence and provenance