
Official Belgian data, explained
Non-zero-income declarations by municipality in Belgium (2023)
This page maps Non-zero-income declarations for one nationally comparable 2023 slice. Every figure below uses the same disclosed definition, unit, geography and source.
Income
What this indicator measures
Tax declarations with non-zero net taxable income.
Official Statbel measure for Non-zero-income declarations.
Indicator dossier
Data passport
- Selected reference period
- 2023
- Geography
- municipalities
- Boundary set
- Statistical sectors 2023
- Measure
- Value
- Unit
- declarations
- Comparable areas
- 581
- Coverage
- 100%
Latest published slice
How to read the pattern
- Median
- 7,476declarations
- Unweighted area mean
- 11,783declarations
- Minimum
- 41declarations
- Maximum
- 313,807declarations
Across the valid national comparison set, the median is 7,476 declarations. Values extend from 41 to 313,807 declarations. This describes geographic variation; it is not a score of local quality.
Geography
Map of Belgium
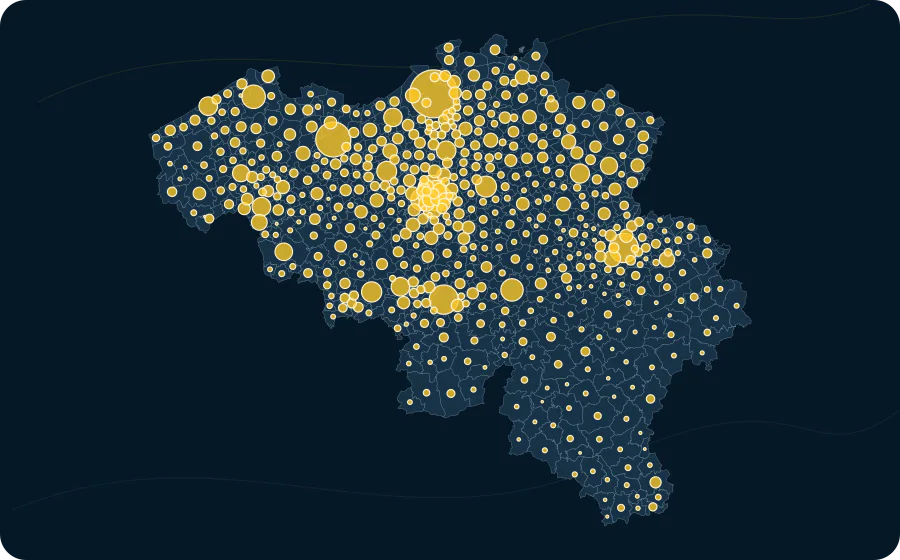
- 313,807circle area
- 7,476circle area
- 4,373circle area
Areas
Value distribution
| Value | Areas |
|---|---|
| 41–13,115 | 438 |
| 13,115–26,188 | 105 |
| 26,188–39,262 | 15 |
| 39,262–52,335 | 11 |
| 52,335–65,409 | 4 |
| 65,409–78,483 | 3 |
| 78,483–91,556 | 0 |
| 91,556–104,630 | 1 |
| 104,630–117,703 | 2 |
| 117,703–130,777 | 0 |
| 130,777–143,850 | 0 |
| 143,850–156,924 | 0 |
| 156,924–169,998 | 1 |
| 169,998–183,071 | 0 |
| 183,071–196,145 | 0 |
| 196,145–209,218 | 0 |
| 209,218–222,292 | 0 |
| 222,292–235,366 | 0 |
| 235,366–248,439 | 0 |
| 248,439–261,513 | 0 |
| 261,513–274,586 | 0 |
| 274,586–287,660 | 0 |
| 287,660–300,733 | 0 |
| 300,733–313,807 | 1 |
Explore this exact slice in the atlas Download this data as CSV
municipalities
Highest and lowest values
From 581 comparable areas, the table shows a concise descriptive high-and-low sample. Equal values do not imply equal local circumstances.
| Highest | 1 | Antwerpen | 11002 | 313,807 declarations |
|---|---|---|---|---|
| Highest | 2 | Gent | 44021 | 166,317 declarations |
| Highest | 3 | Liège | 62063 | 116,870 declarations |
| Highest | 4 | Charleroi | 52011 | 116,616 declarations |
| Highest | 5 | Bruxelles | 21004 | 102,139 declarations |
| Highest | 6 | Brugge | 31005 | 75,477 declarations |
| Highest | 7 | Namur | 92094 | 68,645 declarations |
| Highest | 8 | Schaerbeek | 21015 | 67,430 declarations |
| Highest | 9 | Anderlecht | 21001 | 65,124 declarations |
| Highest | 10 | Leuven | 24062 | 60,076 declarations |
| Lowest | 581 | Herstappe | 73028 | 41 declarations |
| Lowest | 580 | Mesen | 33016 | 616 declarations |
| Lowest | 579 | Daverdisse | 84016 | 814 declarations |
| Lowest | 578 | Herbeumont | 84029 | 997 declarations |
| Lowest | 577 | Martelange | 81013 | 1,045 declarations |
| Lowest | 576 | Spiere-Helkijn | 34043 | 1,210 declarations |
| Lowest | 575 | Horebeke | 45062 | 1,236 declarations |
| Lowest | 574 | Rouvroy | 85047 | 1,253 declarations |
| Lowest | 573 | Fauvillers | 82009 | 1,274 declarations |
| Lowest | 572 | Bever | 23009 | 1,283 declarations |
Method and limitations
Method and limitations
No missing value is imputed. Where colour classes are used, their breaks and colours come from the catalogue; source-declared suppression remains missing.
The area mean gives every published geographic area equal weight. It is not weighted by population, exposure or area size.
Income year: the calendar year in which the taxable income was earned.
Read the methodologySources, licence and provenance